Leveraging BigQuery and LiDAR for Geospatial Analysis


In the realm of geospatial analysis, the ability to efficiently handle large and complex datasets is not just a convenience—it's a necessity. LiDAR technology, which captures the earth's surface with precision by using light detection and ranging, generates massive amounts of 3D point cloud data, often stored in LAS file formats. This rich, detailed data is invaluable across numerous industries, from urban planning and environmental monitoring to autonomous vehicles and archaeology. However, the sheer size of LAS files can become a stumbling block, leading to inefficient workflows and collaboration challenges.
Enter BigQuery, Google Cloud Platform's fully managed, petabyte-scale data warehouse that changes the geospatial game. By uploading LAS files to BigQuery, we open a door to seamless collaboration, where the complexities of file size and data management fade into the background. Here are some transformative benefits of bringing your LAS data into BigQuery:
Unified Data Ecosystem: BigQuery acts as a centralized repository where teams can access and work off the same LAS dataset. This eliminates the redundancies and inconsistencies that typically arise when data is stored in silos or passed around via hard drives.
Effortless Sharing and Collaboration: With BigQuery, there's no need to send gigabyte-sized files through traditional file transfer methods. Teams can query and share insights directly within the platform, fostering a collaborative environment where data drives decisions.
Scalability and Performance: BigQuery's infrastructure is designed to scale automatically to meet the demands of querying large datasets. Users can execute complex geospatial analyses on LAS data without the performance lags that often accompany desktop-based processing.
Advanced Filtering and Analysis: Transforming LAS data within BigQuery allows users to apply advanced filtering, perform spatial joins, and leverage machine learning capabilities. These actions can be done on-the-fly, enabling deeper insights with granular control over the data.
Integration and Accessibility: BigQuery integrates with other Google Cloud services and third-party tools, enhancing its functionality. Whether it's visualizing data with Google Data Studio or using AI Platform for predictive modeling, the possibilities extend as far as the user's creativity.
By transitioning to BigQuery for LAS file handling, we're not just simplifying the technical process; we're reshaping the landscape of geospatial data analysis. The platform empowers users to focus on what truly matters—deriving actionable insights from their data. In the following sections, we will delve deeper into each of these benefits, illustrating how BigQuery is an indispensable tool for LiDAR specialists and geospatial analysts who seek to elevate their projects to new heights of efficiency and collaboration.
Integrating LAS 1.2 Schema with BigQuery:
The LAS 1.2 schema, fundamental for LiDAR data, contains detailed spatial information within a structured format. By uploading this schema into BigQuery, we can leverage its powerful geospatial capabilities to execute spatial queries, extract subsets of data on demand, and avoid the inefficiencies of handling entire datasets at once. This approach not only streamlines data management but also harnesses BigQuery's advanced analytics to extract meaningful insights from complex geospatial information. Converting Binary LAS Files for BigQuery with Python
To prepare LAS files for BigQuery, they must be converted from their native binary format into a BigQuery-compatible format, like newline-delimited JSON or CSV. This conversion process can be achieved using Python, which offers libraries such as laspy for reading LAS files and pandas for data manipulation.
A Python script would typically follow these steps:
Read the LAS File: Use laspy to open and read the LAS file, accessing point records and header information.
Extract Relevant Data: Parse the necessary fields from the point records—such as coordinates, intensity, and classification.
Transform the Data: Convert the extracted data into a pandas DataFrame, enabling further manipulation.
Export to CSV/JSON: Utilize pandas to export the DataFrame to CSV or JSON format, structuring the data for BigQuery compatibility.
Optimize and Validate: Ensure the data aligns with BigQuery's schema requirements and optimize it for efficient querying. With the data in the right format, you can then upload it to BigQuery, where you can run your spatial queries and share insights across your organization.\
With the data in the right format, you can then upload it to BigQuery, where you can run your spatial queries and share insights across your organization.
rom google.cloud import bigquery

from google.oauth2 import service_account

import laspy
import pandas as pd

# Load the LAS file
las = laspy.read('path_to_your_file.las')

# Create a DataFrame with the desired fields from the LAS file
df = pd.DataFrame({
    'X': las.x,
    'Y': las.y,
    'Z': las.z,
    'Intensity': las.intensity,
    'ReturnNumber': las.return_num,
    'NumberOfReturns': las.num_returns,
    'ScanDirectionFlag': las.scan_dir_flag,
    'EdgeOfFlightLine': las.edge_of_flight_line,
    'Classification': las.classification,
    'ScanAngleRank': las.scan_angle_rank,
    'UserData': las.user_data,
    'PointSourceId': las.pt_src_id,
    'GPS_Time': las.gps_time
})

# Convert the DataFrame to a CSV file
csv_file = 'path_to_output_file.csv'
df.to_csv(csv_file, index=False)

print(f"LAS file has been converted and saved as '{csv_file}'")
Initialize BigQuery client and set up authentication with your service account
from google.cloud import bigquery
from google.oauth2 import service_account

# Initialize BigQuery client and set up authentication with your service account
credentials = service_account.Credentials.from_service_account_file(
    'path_to_your_service_account_json_file.json'
)
client = bigquery.Client(credentials=credentials, project=credentials.project_id)

# Define your BigQuery dataset and table
dataset_id = 'your_dataset_id'
table_id = 'your_table_id'

# Set the path for the CSV file to upload
csv_file = 'path_to_output_file.csv'

# Create a job configuration
job_config = bigquery.LoadJobConfig(
    source_format=bigquery.SourceFormat.CSV,
    skip_leading_rows=1,  # Skip the header row
    autodetect=True,  # Auto-detect the schema
)

# Get the dataset and table references
dataset_ref = client.dataset(dataset_id)
table_ref = dataset_ref.table(table_id)

# Create a load job to upload the CSV to BigQuery
with open(csv_file, "rb") as source_file:
    job = client.load_table_from_file(source_file, table_ref, job_config=job_config)

# Wait for the job to complete
job.result()  # Waits for table load to complete.

print(f"CSV file '{csv_file}' has been uploaded to BigQuery table '{table_id}'")
Example 1: Querying a Particular Spatial Area
Let's assume you've successfully uploaded your LiDAR data to BigQuery and have a table with geospatial fields. You want to perform a query to select only the points within a specific geographic area—perhaps a particular plot of land. Here’s how you could construct such a query:
SELECT *
FROM `your-project.your_dataset.your_table`
WHERE ST_Within(
  ST_GeogPoint(X, Y),
  ST_GeogFromText('POLYGON((-121.89291 37.335480, -121.89291 37.338735, -121.889652 37.338735, -121.889652 37.335480, -121.89291 37.335480))')
)
This query uses the ST_Within function to filter points to those inside the defined polygon, which you need to specify in Well-Known Text (WKT) format.
Example 2: Filtering for Last Return Points
In LiDAR data, the last return can provide insights into the ground surface, which is critical for creating Digital Elevation Models (DEMs) or Digital Terrain Models (DTMs). Here’s a query that selects only the last return points:
SELECT *
FROM `your-project.your_dataset.your_table`
WHERE ReturnNumber = NumberOfReturns
This simple query filters the dataset to return only those points where the ReturnNumber matches the NumberOfReturns, indicating these are the last returns.
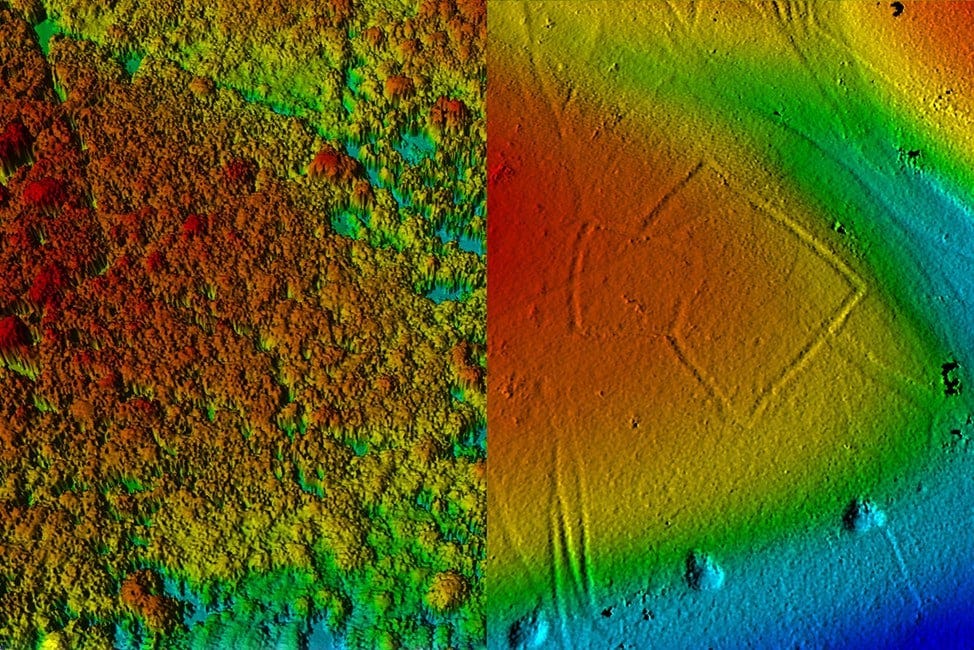
Demonstrating the capabilities of LiDAR technology in revealing hidden archaeological features. The right image shows a full LiDAR point cloud with canopy well visible, and the right shows the surface derived from the last returns of the LiDAR cloud(Historic England, 2006).
Example 3: Determining Approximate Canopy Height
Let’s look at a more complex geospatial analysis example!
WITH GroundReturns AS (
  SELECT X, Y, Z AS GroundZ
  FROM `your-project.your_dataset.your_table`
  WHERE ReturnNumber = NumberOfReturns
),
CanopyReturns AS (
  SELECT X, Y, MAX(Z) AS CanopyZ
  FROM `your-project.your_dataset.your_table`
  WHERE ReturnNumber != NumberOfReturns
  GROUP BY X, Y
)
SELECT
  g.X, g.Y,
  c.CanopyZ - g.GroundZ AS VegetationHeight
FROM GroundReturns g
JOIN CanopyReturns c ON g.X = c.X AND g.Y = c.Y
This query uses two Common Table Expressions (CTEs): GroundReturns isolates the last returns to approximate ground level. CanopyReturns identifies the highest point of non-ground returns, assuming this to be canopy level.
Finally, it joins these two CTEs on their X and Y coordinates to calculate the height of vegetation at each point by subtracting GroundZ from CanopyZ. Note: The actual implementation might be more complex and require additional filtering based on other attributes like Classification to differentiate between ground and non-ground points accurately. This example showcases the power of BigQuery to perform complex geospatial computations directly within SQL queries, eliminating the need for additional GIS software processing steps.
This example showcases the power of BigQuery to perform complex geospatial computations directly within SQL queries, eliminating the need for additional GIS software processing steps.
Example 4: Identifying Optimal Locations for Urban Green Spaces
Urban planners and geospatial analysts can leverage BigQuery and LiDAR data to identify potential locations for developing green spaces within urban environments. By analyzing elevation, vegetation, and built-up areas, it's possible to pinpoint underutilized areas suitable for transformation into parks or green corridors. Here’s a structured approach using BigQuery:
Data Preparation: Begin with a comprehensive LiDAR dataset of the urban area of interest, ensuring it includes classifications for vegetation, ground, and buildings.
Elevation and Vegetation Analysis: Use BigQuery to filter the dataset for areas with specific characteristics indicative of potential for green space development, such as lower elevation regions not currently classified as built-up areas and possessing a certain threshold of vegetation density.
Query for Potential Green Space Areas:
WITH PotentialAreas AS (
  SELECT X, Y, AVG(Z) AS AvgElevation, COUNTIF(Classification = 'Vegetation') AS VegetationDensity
  FROM `your-project.your_dataset.your_table`
  GROUP BY X, Y
  HAVING AvgElevation < YOUR_ELEVATION_THRESHOLD AND VegetationDensity > YOUR_VEGETATION_DENSITY_THRESHOLD
  AND COUNTIF(Classification = 'Building') = 0
)
SELECT X, Y, AvgElevation
FROM Potential Areas
This query isolates areas that are not currently built-up, have a lower average elevation (indicating less likelihood of flooding or other elevation-related challenges), and possess a minimum density of vegetation, making them prime candidates for green space development.
Integration with Urban Planning Objectives: The identified potential areas can then be further analyzed in conjunction with other urban planning data, such as population density, accessibility, and existing urban infrastructure, to determine the optimal locations for green space development. This holistic analysis ensures that the new green spaces will provide maximum environmental and social benefits.
Visualization and Further Analysis: Export the results from BigQuery for visualization in tools like Google Earth Engine or Google Data Studio. This allows planners to visually assess the potential green spaces in the context of the urban landscape, facilitating discussions and decisions on urban development plans.
This example demonstrates how BigQuery's processing power, combined with the detailed spatial data from LiDAR, can be instrumental in urban planning. By identifying potential locations for green spaces, urban planners can enhance city livability, environmental sustainability, and community well-being. Moreover, this approach exemplifies how geospatial analysis can inform strategic decisions in urban development, showcasing the versatility and impact of integrating LiDAR data with BigQuery's analytics capabilities.
Thank you for reading! If you enjoyed this content, please like, comment, share, and subscribe for more insightful geospatial discussions. Your support keeps TechTerrain thriving!
References
Historic England. (2006, March). Lidar imagery demonstrating canopy penetration in open woodland in Savernake Forest. Cambridge University Unit for Landscape Modelling. Retrieved from https://historicengland.org.uk/research/methods/airborne-remote-sensing/lidar/
About the Author
Daniel Rusinek is an expert in LiDAR, geospatial, GPS, and GIS technologies, specializing in driving actionable insights for businesses. With a Master's degree in Geophysics obtained in 2020 from the University of Houston, Daniel has a proven track record of creating data products for Google and Class I rails, optimizing operations, and driving innovation. He has also contributed to projects with the Earth Science Division of NASA's Goddard Space Flight Center. Passionate about advancing geospatial technology, Daniel actively engages in research to push the boundaries of LiDAR, GPS, and GIS applications.